
Your OKRs Are Just Quarterly Theater (And Everyone Knows It)
It's week 11 of the quarter. Someone pings the leadership Slack: "OKR check-in today—can everyone update their progress?"
Ten minutes before the meeting, people scramble. Open that spreadsheet. Update the status column. Green, yellow, red. Add a comment: "On track" or "Slight delay but recovering."
The meeting happens. Everyone reports out. Your head of marketing says retention is "trending positive." Your VP of Product says activation is "looking good." Your sales leader says pipeline is "healthy."
Nobody has actual numbers. Nobody's quite sure if their work is moving the company goal. And by the time you do the next check-in three weeks later, the data you're discussing is already stale.
This is what OKRs have become: a quarterly reporting exercise that consumes hours, generates decks nobody reads, and changes exactly nothing about how teams actually work.
The problem isn't the OKR framework. The problem is that your OKRs are disconnected from your data.
The Alignment Gap
Here's what's supposed to happen: Your company sets a North Star. Each department defines Objectives that contribute to that goal. Each team creates Key Results—measurable outcomes they'll drive. Everyone pulls in the same direction.
Here's what actually happens:
Your marketing team has an Objective to "increase qualified leads." Their Key Results live in HubSpot. Your product team has an Objective to "improve activation." Their Key Results live in Amplitude. Your sales team has an Objective to "accelerate pipeline velocity." Their Key Results live in Salesforce.
And your North Star—revenue, ARR, whatever you're optimizing for—lives... in someone's quarterly board deck.
Nobody can see the full picture. Marketing doesn't know if product's activation improvements are helping close deals. Product doesn't know if sales is converting the leads marketing generates. Sales doesn't know if their pipeline velocity is actually contributing to the company goal or just creating busy work.
So you do what every company does: schedule OKR check-ins. Ask people to manually update progress. Export numbers from five different tools. Copy-paste into slides. Present to leadership. Nod along. Schedule the next check-in.
By the time you realize a Key Result is off track, you've burned three weeks. By the time you reallocate resources, the quarter's half over. By the time you actually course-correct, it's time to plan next quarter's OKRs.
Same framework, completely different execution.
What Intruder Figured Out
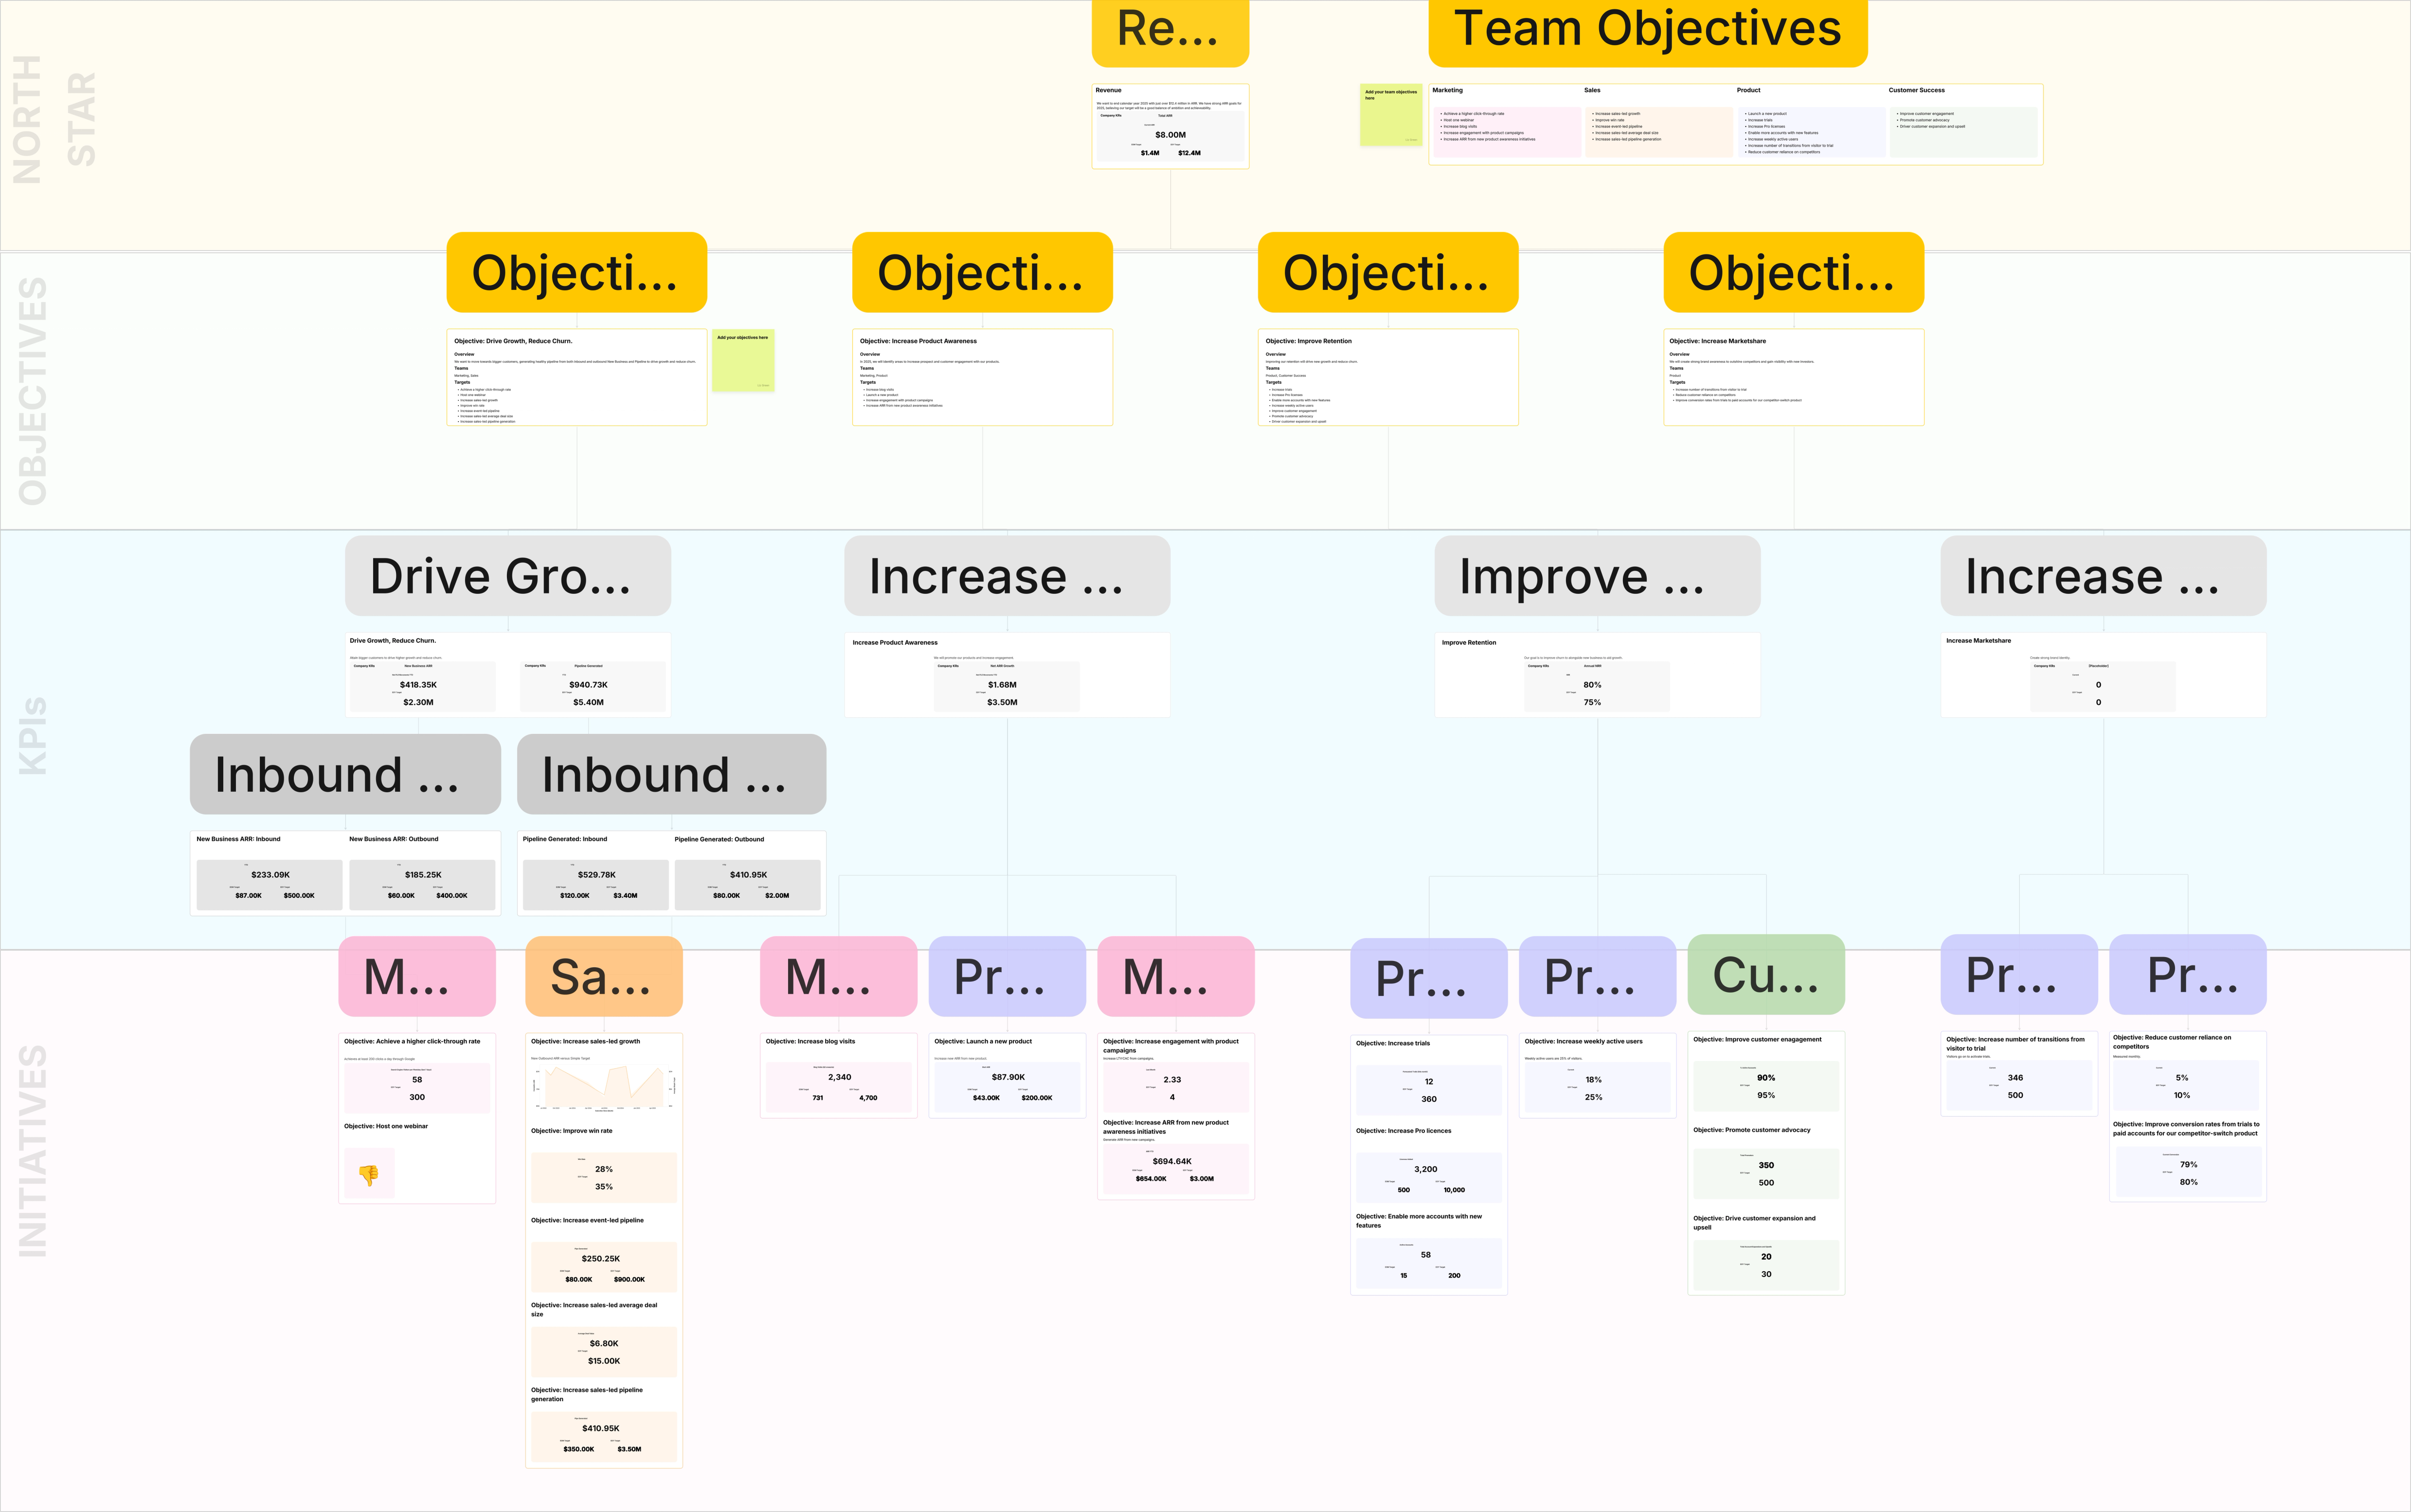
Intruder—a cyber security company that actually runs their business this way—built something smarter: OKRs as a living canvas, not a static report.
Company North Star at the top. Department Objectives below—marketing, product, sales, all mapped to how they contribute. Team-level Key Results beneath that. Individual initiatives and tasks at the bottom. All connected. All showing real data. All updating automatically.
Count's OKR canvas template is based on Intruder's exact approach (with fake data, obviously). Map out your company Objectives. Create team initiatives and KPIs that feed up into those higher-level goals. Connect it to your actual data sources—your CRM, your product analytics, your marketing automation, whatever lives in your data warehouse.
Which is a fancy way of saying: your OKRs stop being quarterly guesswork and start being real-time business intelligence.
Your head of marketing can see their "increase qualified leads" KR (actual MQL numbers from HubSpot, updating daily) and immediately see how it's impacting the company Objective it feeds into. Your VP of Product watches activation rates move and understands whether that's translating to sales velocity. Your CFO—who never had visibility into what individual teams were doing—can now see exactly which initiatives are driving the North Star and which are spinning wheels.
And because it's a canvas, not a dashboard, your leadership team can collaborate on it. Drop a sticky on a lagging Key Result: "What's blocking this?" Start a threaded discussion about whether an initiative should be killed or doubled down on. Comment directly on the metric that just spiked: "This is working—can we replicate it across other teams?"
Cross-functional visibility. Real-time data. Provable connections between daily work and company outcomes.